 Every month we show you the most recent Market Snapshot to give you an update on the state of the real estate market. Last month we walked through each metric in the single-family home report to give you a better understanding of what the numbers mean and how you should use them. This month, we will take a closer look at the attached (condos and townhomes) market to better understand how that segment is performing.
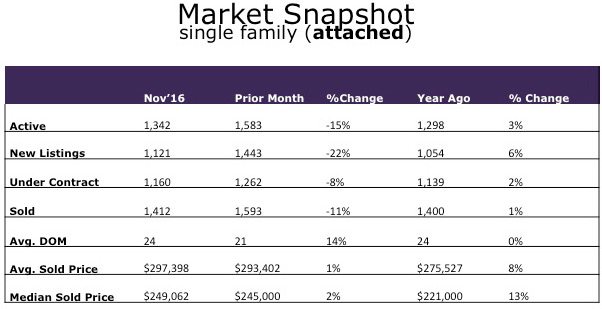
The attached market has been on fire the past few years. Every metric measured has shown enormous demand from buyers and a lack of inventory from sellers. This has led to competing offers and fast rising prices. The year-over-year price increase for attached properties is 8 percent.
The major difference in purchasing an attached property vs. a detached property is understanding the financial health and rules/regulations of the Home Owner’s Association (HOA). The effort to understand and qualify the HOA should be taken very seriously. A bad HOA makes for a bad purchase, plain and simple. The good news is there are well-established metrics and rules to guide us in evaluating an HOA so it’s not guesswork. Condos and townhomes do come with their set of advantages. They usually are more affordable than single-family homes and all of the outside work is usually taken care of by the HOA – a big advantage for many buyers.
The chart shows two different time periods, Prior Month and Year Ago. Prior Month compares the most recent month to the month before (Nov. ’16 vs. Oct. ’16). Year Ago compares the prior month to the same month one year ago (Nov. ’16 vs. Nov. ’15). There are definite seasonal differences in real estate so using month-to-month comparison trends can be somewhat misleading. For example, we expect fewer properties to come on the market during the fall and winter and more listings during the spring and summer. So a word of caution: don’t get too caught up in month-to-month data. Review it, but the year-over-year data is more relevant, useful and instructive. We’ll focus on the year-over-year numbers below.
Active: number of active properties on the MLS – up 3 percent in the past year from 1,298 to 1,342. We have too few listings to satisfy the demand in the market, and the number of listings is not rising significantly. Since demand (people wanting to buy condos and townhomes) is outstripping supply (people selling condos and townhomes) our conclusion is that it remains a strong seller’s market. So far, we have gone through years of continually decreasing inventory with no sign of that changing.
New Listings: number of new listings that were put on the MLS – up 6 percent in the past year, from 1,054 to 1,121. This metric is closely related to actives. Similar to actives, there are still way too few attached properties on the market. So, it’s the same conclusion as above.
Under Contract: number of properties under contract on the MLS at the moment the data was captured – up 1 percent, from 1,400 to 1,412. Even with the reduced inventory, people are still looking to buy condos and townhomes. This number reflects the demand of the market – buyers wanting to buy – even in a market with record low inventory to choose from.
Sold: number of condos and townhomes that were sold – up 2 percent in the past year from 1,139 to 1,160. While everyone talks about what a strong real estate market we have it is shocking that the number of homes sold is dropping, not climbing! Again, this is almost entirely a reflection of the limited inventory (few actives and new listings) for buyers to choose from. As much as folks want to buy homes, there are so few on the market the number of homes sold is falling. Our metro Denver population is increasing 50,000 per year and many of these folks want to buy homes but are not able to because of the limited supply. This is the reason we believe our seller’s market is going to stand strong for several more years – lots of buyers and not enough properties for them to buy. Until more inventory comes on the market, the demand will continue to surpass the supply.
Avg. CDOM: This is the average Combined Days on Market for the properties sold, which remained unchanged. In a balanced market, 90 CDOM is about what we see. In our strong seller’s market this number is very low at 24. It’s just another indication of the strength of this market.
Avg. Sold Price: Up 8 percent. Prices have been rising in metro Denver for the past seven years. It’s interesting to note that in the past 45 years the average price increase for attached homes has been 5.9 percent per year, just below the 8 percent from the past year. Given everything we have discussed above regarding the lack of inventory and demand for housing, we expect prices to continue to rise for a number of years.
Median Sold Price: Up 13 percent. The median sold price is the midpoint number of all the homes sold on the market.
If you’re looking to buy or sell a condo and townhome, it’s very important to understand what the market is telling you. We see a further continuation of a low inventory environment with lots of unsatisfied demand.
